The underpayments cause a loss of 5-12 percent of the practice revenue every year, which is worse than denials since they are undetected. Denials raise red flags, but underpayment disguises itself as a regular payment, weakening the margins undetected. This guide unveils the way to identify underpayments, differentiate them with denials, and reclaim lost revenues in a systematic fashion.
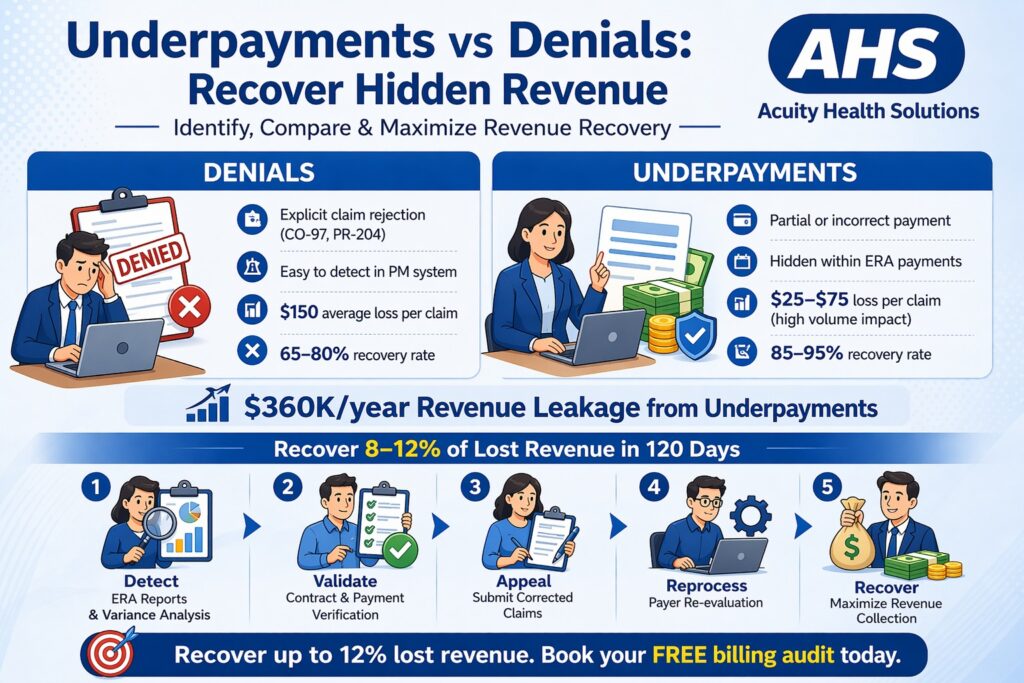
Underpayments vs Denials: Key Differences
| Denials | Underpayments |
| Explicit rejection (CO-97, PR-204) | Partial/incorrect payment |
| Immediate visibility in PM system | Hidden in ERA payments |
| Appeal window: 30-180 days | Contractual appeal: 12-24 months |
| Average loss: $150/claim | Average loss: $25-75/claim x volume |
| Recovery rate: 65-80% | Recovery rate: 85-95% |
Real Impact
1,000 claims/mo × 5% underpayment × $50 avg = $30,000/month ($360K/year) leakage.
7 Common Underpayment Scenarios
The most common underpayment scenarios are:
1. Contractual Adjustment Errors
Payer contract: $125 CPT 99214
ERA pays: $112
Difference: $13 × 150 claims/mo = $1,950 leak
2. Fee Schedule Drift
Payers fail to update rates per amended contracts. Blue Cross most common offender.
3. Bundling Misapplication
99214 E/M + 93000 ECG
Payer bundles ECG into E/M
Expected: $125 + $18 = $143
Paid: $125 only
4. Modifier Denials Paid as Underpayments
-25 mod rejected but partial E/M paid
Loss: Procedure code entirely
5. DRG/APC Weight Errors (Hospital)
Outpatient APC 5731 underpaid by 15% weight.
6. Secondary Claims Not Filed
Primary balance is paid out at $800/10K allowed, secondary balance disregarded.
7. Zero‑Pay Claims
Cases that have been processed but reimbursed as $0 because of auth/contract.

How to Identify Underpayments Systematically
Here are some ways to identify underpayments systematically:
1. ERA Variance Reports (Weekly)
Run weekly: Expected vs. Actual payments
Filter: >$5 variance per claim
Prioritize: High‑dollar CPT codes
2. Contract Management Software
Change Healthcare Contract Analyzer
Victor Claims Manager
Medusind Contract Analyzer
3. Payer Benchmarking
Medicare: 100% contractual (MPFS lookup)
Commercial: Compare vs. 3 peer practices
4. Statistical Sampling
20% claim sample monthly → extrapolate losses.
Step‑by‑Step Underpayment Recovery Process
Week 1: Detection
1. Export 90‑day ERAs to Excel
2. VLOOKUP expected fees (contract database)
3. Flag >$5 variances
Week 2: Validation
- Check patient responsibility deducted.
- Verify correct Modifiers/procedures billed.
- Cross-check remittance of payers.
Week 3: Appeal Submission
Template: “Payment variance CPT XXXXX, DOS MM/DD
Expected: $XXX per contract amendment 20XX
Paid: $XXX
Please reprocess or explain discrepancy”
Week 4: Escalation
State insurance departments for chronic offenders.
Technology Tools for Underpayment Recovery
1. Epic Revenue Cycle
Auto‑variance flagging
Contract engine integration
Appeal letter generation
2. Athenahealth
Underpayment work queues
Payer performance scorecards
Automated appeals
3. Change Healthcare
Contract analyzer ($5K/yr)
3‑way variance matching
Bulk appeal submission
Financial Impact & ROI
- Practice: 5 providers, 2K claims/mo
- Underpayment rate: 7% @ $35 avg
- Annual leakage: $588K
- Recovery rate: 85%
- Net gain: $500K/yr
- Tool cost: $25K
- ROI: 20x
Actionable Next Steps
1. 1. 90 days retrospective this week.
2. Use weekly variance reports.
3. Invest in contract management tool
4. Train 1 staffer as underpayment specialist
Result
8-12% recovery in 120 days.
Struggling with underpayments? Acuity Health Solutions recovers 92% of identified underpayments with automated variance analysis and dedicated appeal teams.
Conclusion
Change your Revenue Cycle Today.
Medical billing excellence is not a choice but rather it is your competitive edge. Acuity Health Solutions is a provider of AI-based automation, certified coding, and mastery of end-to-end RCM to provide 98% clean claims, 24-day A/R and 25% reduction of denials to practices across the country.
Do not allow billing mistakes to wipe out your profits. The combination of our open 4-6% fee model, HIPAA-compliant technology and established scalability makes us the partner that growing practices rely on. Since small groups to multi-specialty businesses, we have handled over $300M in claims retaining 99 percent of clients.
Manage your revenue destiny. Book your free billing audit today and find out the hidden revenue sources worth $50K-500K and unlock them.


