Essential Medical Billing KPIs for Better Revenue Control
Medical billing KPIs are needed in tracking the practice that would want to know the cash flow and efficiency of their operations to be predictable. These metrics can tell about billing bottlenecks, problems with payers, and revenue leakage – before it hits your bottom line.
At Acuity Health Solution, we have assisted hundreds of practice sites in the U.S. in streamlining their revenue cycle using intelligent data. The following are the 7 medical billing key performance indicators that every practice should consider monthly and benchmark using industry average figures.
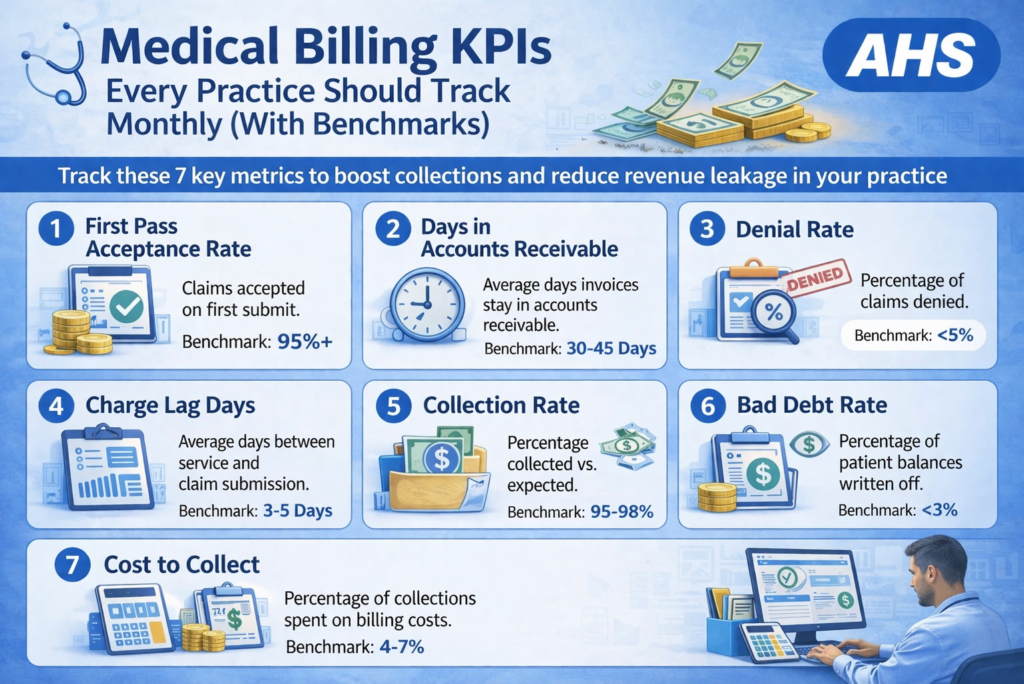
1. First Pass Acceptance Rate (Clean Claims Rate)
What it measures: Percentage of claims accepted on first submission without rework.
Benchmark: 95%+ (industry average: 85–90%)
Low clean claims only indicate errors in coding, incomplete documentation, or registration. A 5% increase will contribute thousands of monthly collections.
Action: Monthly review the top 5 denial reasons, educate staff on common CPT/ICD -10 mismatches.
2. Days in Accounts Receivable (A/R Days)
What it measures: The average days to collect payment following the service date.
Benchmark: 30–45 days (surgical specialties: 40–60 days)
Long A /R is a consummation of working capital and is an indicator of delayed follow-up or delays in payment. Goal of less than 45 days primary, 60 specialty.
Action: Age analysis- 30-60 day claims should be given priority; 90+ day AR should be followed up on specifically.
3. Denial Rate (Net Denial Rate)
What it measures: What percentage of claims on appeal made have been denied (excluding reclaimed amounts).
Benchmark: <5% (industry average: 8–12%)
High denials erode margins. Track by payer and reason code (e.g., CO‑97 duplicate, CO‑16 claim lacks auth).
Action: Monthly report on the trend of denials; top 3 codes of denial root cause analysis.
4. Charge Lag Days
What it measures: Days between the date of service and the submission of claims.
Benchmark: 3–5 business days
Why it matters: Late entry Charges = Late cash. One day of charge lag increases A/R by 12 days each day.
Action: Daily charge capture to be implemented; superbill reconciliation to be automated.
5. Collection Rate (Net Collection Rate)
What it measures: Actual collections ÷ expected reimbursements (contractual adjustments excluded).
Benchmark: 95–98%
It discloses underpayment or an untaken appeal. When it is less than 95 per cent, then it means systemic Revenue Leakage.
Action: Payer contract review; underpayment audit every quarter.
6. Bad Debt Rate
What it measures: Patient balances written off ÷ total charges.
Benchmark: <3% of net collections
Why it matters: An increase in bad debts is an indicator of patient collection problems or poor financial counseling.
Action: Advance eligibility test; payment schemes of the high-deductible clients.
7. Cost to Collect
Ratios that it measures: Billing department expense/ collections.
Benchmark: 4–7% of collections
Huge costs wear down margins. Outsourcing usually attains 3-5% vs. in-house 8-12%.
Action: Compare to peers; assess ROI outsourcing.
Payer Performance Breakdown
Medicare also has a clean claim of 95%+ with an average payment of 45-60 days.
Commercial payers have 85-90% clean claims that have faster reimbursements (between 30–45 days) but increased rates of denial (between 10-15%).
Medicaid is behind with 75-85% clean claims, and 60-90 day A/R. Report each pays the separate KPI in your monthly scorecard with columns devoted to each payer. This is an indicator of poor performance in the contract and an action to negotiate.
Apply denial reason codes by payer to focus training and process improvement in the areas that will have the greatest ROI.
Pro Tips from Acuity Health Solutions
- Automate tracking with PM/EHR dashboards (Epic, Athenahealth, Kareo)
- Segment by payer—Medicare vs. commercial performance differs widely
- Set alerts on KPIs that decrease 10 percent per month.
- Quarterly deep dive- study trends more than monthly.
Regular KPI checking is a way to change reactive billing to proactive revenue management. It is not only that practices typically make 15 percent to 25 percent more in 6 months using these benchmarks.
Have trouble with benchmarking your practice? Contact Acuity Health Solutions to get a free KPI assessment of medical billing.