Using RCM Dashboards to Identify Revenue Leakage Early

Using RCM Dashboards to Identify Revenue Leakage Early

Revenue leakage is the silent killer that eats up 10-18% of practice collections each year. RCM dashboards identify such problems in less than 30 days as opposed to identifying them during the end-of-year audit. This guide unveils the 7 important dashboard metrics practice managers should keep watch on to seal the revenue leaks before they can affect the cash flow.

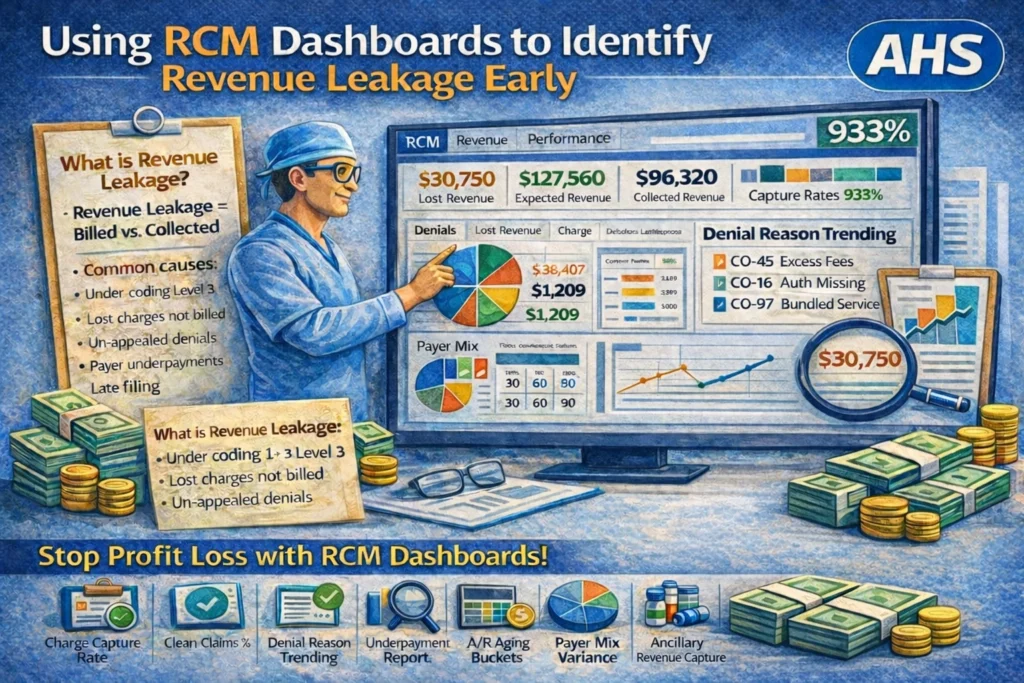
What is Revenue Leakage?

Revenue leakage = difference between billed and collected with contractual adjustments. 

Common causes:

  • Level 3 under-codified (Level 2 billed as Level 3) services.
  • Lost charges (ancillary services not recorded)
  • Denials not appealed (technical vs. clinical)
  • Underpayments (payer contract discrepancies)
  • Late filing (claims older than 90 days)

Industry standard: The leakage should be below 3% of gross charges.

7 Dashboard Metrics That Catch Leakage Early

1. Charge Capture Rate (Daily)

Target: 98%+  

Formula: Captured charges ÷ Encounter volume

Red Flag: 95% of missed injections, procedures, or point-of-care testing.

Action: Daily superbill reconciliation.

2. Clean Claims % (Daily)

Target: 95%+  

Red Flag**: <90% = coding errors, auth issues

Virginia/Arizona Case Study: Anthem BCBS LCD discrepancies will result in 25% rejections.

3. Denial Reason Trending (Weekly)

Top Leakage Codes:

CO-45: Charge exceeds fee schedule

CO-16: Auth missing  

CO-97: Bundled service

Action: The top 3 denial codes receive workflow corrections.

4. Underpayment Report (Monthly)

Formula: Expected reimbursement – Actual payment

Target: <$500/mo per provider

Example: Medicare pays $85, contract says $92 = $7 leakage per claim.

5. A/R Aging Buckets (Weekly)

90+ days >10% total A/R = Leakage alert

120+ days >5% = Write-off risk

Action: First (LIFO) old claims.

6. Payer Mix Variance (Monthly)

Medicare: Expected 95% collection rate

Commercial: Expected 92-97%

Medicaid: Expected 88-92%

Red Flag: Medicare collecting less than 90% is an indicator of underpayments.

7. Ancillary Revenue Capture (Monthly)

Injection revenue: 85%+ capture rate

Point-of-care testing: 90%+ capture

DME/Orthotics: 80%+ capture

Leakage: 50 percent missed injections of Kenalog = loss of 25k a year.

RCM Dashboard Setup Best Practices

1. Epic Caboodle / Athenahealth

Pre-built: Denial trends, A/R aging, clean claims

Custom: Charge capture by ancillary service

Export: Weekly Excel pivot tables

2. Kareo / AdvancedMD

Focus: Underpayment reports, payer variance

Alert: Claims >60 days auto-escalate

Drill-down: Denial reason by CPT code

3. Practice-Fusion / eClinicalWorks

Simple KPI cards: Clean claims, A/R days

Red/Yellow/Green thresholds

Mobile alerts for managers

Regional Dashboard Considerations

Virginia Practices:

Anthem BCBS: Site-of-service differentials  

Virginia Medicaid: Dental carve-out tracking  

Magellan BH: Auth compliance dashboard

Arizona Practices:

AHCCCS: Prior auth dashboard  

Banner Health: Hospital-clinic splits  

BCBS AZ: Commercial underpayments

Actionable Leakage Recovery Workflow

Week 1: Dashboard training (30 min)

Week 2: Baseline leakage audit

Week 3: Top 3 fixes implemented

Week 4: 5-8% leakage reduction expected

Monthly Routine:

Monday: Dashboard review (15 min)

Wednesday: Denial root cause fixes

Friday: AR follow-up calls

Results from Dashboard Implementation

Practice Size → Leakage Reduction → Annual Savings

3 Providers → 12% → $187K

15 Providers → 8% → $1.2M  

75 Providers → 6% → $4.8M

Key Finding: 85% of leakage is recoverable when caught <90 days via dashboards.

Bottom Line

RCM dashboards transform reactive billing into proactive revenue insight. Practices using these 7 metrics will recover 12-18 % of the lost revenue in 90 days.

Require RCM dashboard? Acuity Health Solutions is offering Virginia, Arizona, and national practice custom KPI dashboards featuring weekly leakage alerts.

Tags