The denials of the claims in Medicare are frequently a result of the Local Coverage Determinations (LCDs) that override the National Coverage Determinations (NCDs). This hierarchy is very important to understand, with practices in areas where local policies are very tough. One LCD discrepancy will lead to 20-30% denials of some procedures.
This guide breaks down LCDs vs NCDs, their impact on claim approval, and actionable strategies to navigate local Medicare policies effectively.
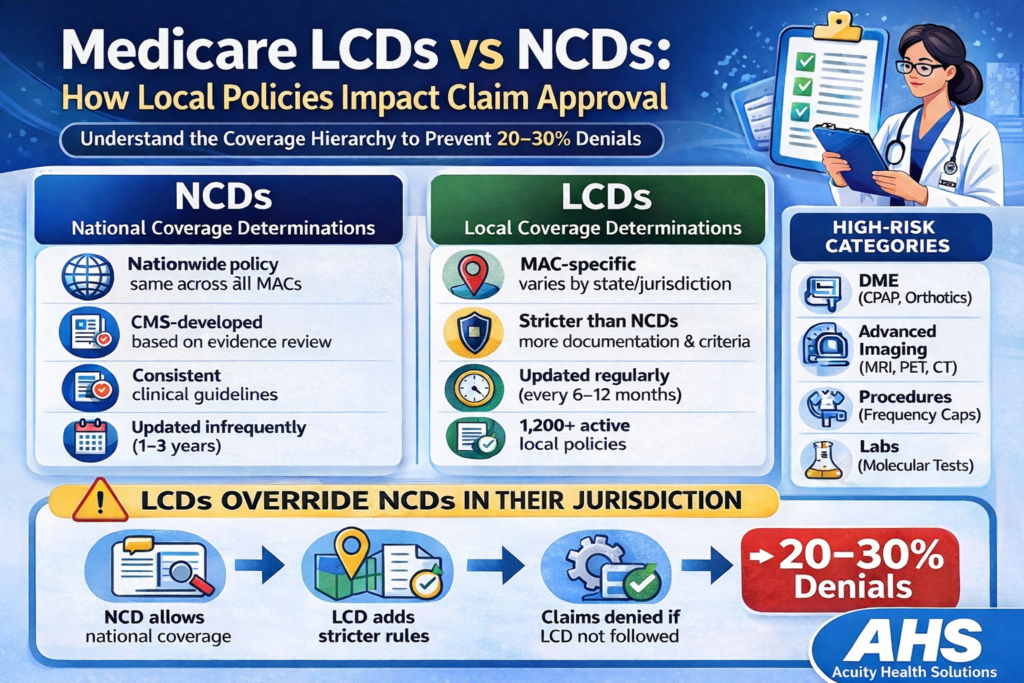
NCDs: National Coverage Policies
National Coverage Determinations (NCDs) provide consistent Medicare coverage in all MAC jurisdictions in the entire country:
Examples of NCDs:
Genetic testing (NCD 90.2) – Nationally covered
PET scans for Oncology Medical Billing (NCD 220.6.17) – Specific indications
Home sleep testing (NCD 240.4) – Approved devices
Bariatric surgery (NCD 40.1) – BMI + comorbidity requirements
Key NCD Characteristics:
- Nationwide, although not regional.
- CMS is developed centrally in the form of an evidence review.
- Difficult to appeal – Established clinical guidelines.
- Updated infrequently (1-3 years)
LCDs: Local Coverage Policies
Local Coverage Determinations (LCDs) are policies that are stricter than NCDs that are policies in their jurisdiction:
LCD Impact Examples:
Jurisdiction 5 (Palmetto GBA) → Wound care LCD L35041
– Debridement frequency limits
– Selective vs. non-selective coding rules
Jurisdiction 8 (WPS) → Pain management LCD L34624
– ESI frequency caps (3/year)
– Radiofrequency ablation documentation
Jurisdiction F (First Coast) → Sleep medicine LCD L33822
– Home sleep test device restrictions
LCD Characteristics:
- MAC dispensation in their states.
- In most cases, stricter than NCDs.
- Revised regularly (after every 6-12 months).
- Active LCD List 1,200 or more policies.
LCDs Override NCDs: The Coverage Trap
Critical Rule: LCDs supersede NCDs within their jurisdiction.
Here’s how this creates claim denial traps:
NCD 220.6.17 → PET scans covered nationally for breast cancer
LCD L34705 (Noridian JE Part B) → Requires biopsy + specific stage
RESULT: Biopsy‑negative Stage I denied despite NCD coverage
High‑Risk LCD Categories:
- DME (CPAP, orthotics, power mobility)
- State-of-the-art imaging (MRI, PET, CT limitations).
- Operation (frequency caps, location of service),
- Lab/Pathology Medical Billing (restrictions on molecular tests)
How to Navigate LCD/NCD Conflicts
1. LCD Lookup Process
Step 1: CMS.gov → Medicare Coverage Database
Step 2: Enter CPT/HCPCS code
Step 3: Filter by MAC jurisdiction
Step 4: Review ” Medical Billing and Coding Article” (A-codes)
2. Pre‑Service Compliance Checklist
Verify patient’s MAC jurisdiction (ZIP code lookup)
Cross‑reference CPT vs. active LCDs
Document LCD‑specific medical necessity
Obtain LCD‑required prior auth
Use LCD‑mandated diagnosis codes
3. Documentation Gold Standards
❌ “Patient needs MRI”
“LBP >6wks, failed PT x12 sessions, no red flags per LCD L34705”
Practice Impact & Financial Risk
LCD Non‑Compliance Costs:
Scenario: 100 MRI claims/month @ $800 reimbursement
LCD compliance: 95% approval
LCD ignorance: 65% approval (30% denial = $7,200/mo loss)
Annual impact: $86,400 revenue leakage
Solutions by Practice Type:
Hospitals → Enterprise LCD tracking software
Solo → Monthly LCD alert service
Groups → Dedicated Medicare compliance officer
Actionable Implementation Steps
1. Monthly LCD Monitoring
- Retirement/Active list CMS LCD.
- MAC quarterly policy reports.
- CPT code surveillance, High Volume.
2. Staff Training Protocol
Week 1: Mapping of jurisdiction LCD.
Week 2: Specialty Top 10 LCDs.
Week 3: Documentation templates
Week 4: False denials appeals.
3. Technology Solutions
- LCD lookups API (Availity, Change Healthcare).
- LCD LCD Rules engine Claim scrubbing.
- Live eligibility featuring policy flags.
Conclusion
25-35% of Medicare denials are prevented by LCD awareness. Proactive management practices that control local policies attain 97+ clean claim rates as compared to the industry average of 85.
Requiring LCD compliance skills? Acuity Health Solutions offers jurisdiction-specific Medicare billing that has 98% clean claim rates in the country.